
Reading player HP from static health bar
This article, completely original, is copyrighted by its author, me. Please do not reproduce it.
本文为原创作品,作者 Kolyn090 拥有其著作权,受法律保护。严禁复制、转载、仿冒或以任何形式使用。
Category: Tutorial
Platform: Windows
Prerequisite: Basic Python, read this article
Introduction
This is the very first thing we are going to do for a big plan! Today we will be reading the player’s health point from a health bar using Computer Graphics techniques. You should be able to apply what you will be learning to most of the basic health bars.
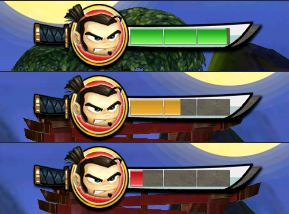
Before we get into the tutorial, we need to understand what exactly is a health bar to us.
- It represents the health point of something (e.g. Your character) and it usually consists of a filling area and a background.
- Larger the filling area means more health. The filling area and the background usually have different colors.
- Sometime a numerical representation is shown next to the health bar, and it would be much easier to read that instead (but unfortunately we don’t have that in this case).
- The color of the filling area and background could be complex! Luckily in this case it’s simple. If you are working with some very interest cases you will have to do some additional tricks / use Cheat Engine to read the value.
The general idea
As usual, let’s plan out the approach step by step. Assuming you have the screenshot from the game.
1 . Crop out the health bar.
2 . Select pivot rows.
3 . Color quantization.
4 . Calculate background area.
5 . Remaining HP = 1 - (background area / total area).
The first step is perhaps the most important one among them! You might not even get a result if you don’t do this correctly. Make sure you include only the necessary part. Otherwise you will run into problems in color quantization (color reduction). If the hp bar is static, you can predefine a bound for hp bar. If it’s moving, the difficulty will exponentially increase! Fortunately in our case it’s static.
The second step is optimization. I hope you can agree with me that there is no need to process the entire hp bar. Here is what I mean:
You can see that it’s good enough to just take the central rows, like shown in the image. We will get a very close result as well by processing this smaller region. In fact, we can even combine step 1 and step 2 together but I won’t do that so that you could get a better idea.
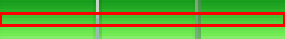
The third step is color quantization. It’s a fancy word saying reducing the number of colors in the image. Visually, it’s like:


Here the quantization algorithm has reduced 97 colors (top) to 3 colors (bottom). We do this to reduce noises in the image. In our case, we want to reduce to 2 ~ 3 colors so that we the filling area and the background can be easily distinguished.
Now comes the fourth step. You might be wondering why we choose to calculate the background color area instead of the filling area. Well, by observing our hp bar we find out that the color of our filling area is changing (green - yellow - red) while the background color is always gray. That gives a good reason why we choose that over the other. In the fifth step, we will use this area to divide by the area of the hp bar image to get the ratio of background, which is the ratio of lost HP. To get the remaining HP, it’s just 1 - lost HP.
Step 1
Again, I really assumed you have read and followed the pachinko series I wrote. It’s going to be very hard to follow the rest if you don’t.
Since we are going to build an entire AI model and this is the first step, I will start a new folder ai. Inside that, create a new folder player_hp and a python script ui_position.py. Inside player_hp, create a new folder debug and a new python script player_hp.py.
ai
|__ player_hp
|   |__ debug
|   |__ player_hp.py
|__ ui_position.py
📍 Before we actually add new things, let’s fix a problem came from my side. I must admit that I didn’t know that the Ads in BlueStacks can be hidden! Yes, they can be hidden! Go ahead and read a section called “Solving the first issue” in this article. There is no need to read anything else. After you have done that you will not longer see the Ads. Please make sure you hide the Ads because the rest of the series will be based on the version without Ads.
In window_rescaler.py, change this line
top, left, bottom, right = 0, -164, 482, 819to
top, left, bottom, right = 0, 0, 482, 819🤓 Since we have hidden the Ads widget, we need to add that back to left.
Inside ui_position.py, put
player_hp_bound = [434, 62, 529, 75]🤓 As said before, it is important to make sure that this is your actual player hp bound. Next we will be verifying you have gotten the correct bound.
Let’s write two new functions in screen_getter.py.
import cv2
import numpy as np

def get_chosen_region(window, region) -> Image.Image:
    def run_win():
        x = window.left + region[0]
        y = window.top + region[1]
        w = region[2] - region[0]
        h = region[3] - region[1]

        return ImageGrab.grab(bbox=(x, y, x + w, y + h))

    if platform.system() == 'Windows':  # Better way to check OS
        return run_win()
    return None

def get_chosen_region_cv2(window, region) -> np.ndarray:
    def run_win():
        img = get_chosen_region(window, region)
        img_cv = np.array(img)

        return cv2.cvtColor(img_cv, cv2.COLOR_RGB2BGR)

    if platform.system() == 'Windows':
        return run_win()
    return None
🤓 get_chosen_region() directly crops out the chosen bound and returns a PIL image. This is more efficient than what we were doing before: take the entire screenshot and crop that. The get_chosen_region() variant outputs a cv2 image.
Now, inside player_hp.py, add the following
import time
import numpy as np
from PIL import Image
from src.program.program_obj import Program_Obj
from src.util.screen_getter import get_window_with_title, get_chosen_region
from src.ai.ui_position import player_hp_bound


class Player_HP:
    def __init__(self, window, pivot_count=1, bg_value=38):
        self._window = window
        self._pivot_count = pivot_count
        self._bg_value = bg_value  # Background value: [38, 38, 38]
        self.debug = False
🤓 Like many UI-related classes from before, it includes a window. The pivot count is for step 2. The bg (background) value is for step 4. I have already explained the high-level idea in the general idea section so I won’t explain them again. In the end, we have debug flag.
Now, in Player_HP, add this function
def get_percentage(self):
    # Step 1
    hp_bar = get_chosen_region(self._window, player_hp_bound)

    if self.debug:
        hp_bar.save('debug/hp_bar.png')

    return 0
Also add the driver code in the same script.
if __name__ == '__main__':
    Program_Obj()
    chosen_window = get_window_with_title('BlueStacks App Player')
    player_hp = Player_HP(chosen_window)
    player_hp.debug = True

    while True:
        print(player_hp.get_percentage())
        time.sleep(0.5)
🤓 Enter battle mode and run the code. You should see zeroes being printed. The important thing to check is hp_bar.png under the debug folder. Make sure you have something similar to this.

🎉 If you did, congratulations! You have done step 1. I hope it wasn’t too bad.
Step 2
In this step we are cropping out the pivot rows from the hp bar image. Add this function to Player_HP class.
def _get_pivot_part(self, hp_bar: Image.Image) -> Image.Image:
    width, height = hp_bar.size

    # calculate cropping box for center pivot rows
    top = (height - self._pivot_count) // 2
    bottom = top + self._pivot_count
    left = 0
    right = width

    return hp_bar.crop((left, top, right, bottom))
🤓 This simply used the crop() function in PIL library to get the centre rows that we are interested in. The new image’s height is equal to the pivot count. Visually, it’s like (not up to scale)

We can add new stuff to get_percentage() now. Modify it like so
def get_percentage(self):
    # Step 1
    hp_bar = get_chosen_region(self._window, player_hp_bound)
    # Step 2
    pivot_part = self._get_pivot_part(hp_bar)

    if self.debug:
        hp_bar.save('debug/hp_bar.png')
        pivot_part.save('debug/pivot_part.png')

    return 0
Run the driver code and check debug. You should be expecting a new image pivot_part.png. Its dimension is something like 95x1 so it might be very hard to see here ⬇️

🎉 That’s all for step 2!
Step 3
In this step we are going to quantize the colors in the pivot part we got from the last step. In get_percentage, modify the code to
def get_percentage(self):
    # Step 1
    hp_bar = get_chosen_region(self._window, player_hp_bound)
    # Step 2
    pivot_part = self._get_pivot_part(hp_bar)
    # Step 3
    quantized3 = pivot_part.quantize(colors=3, method=Image.Quantize.FASTOCTREE)


    if self.debug:
        hp_bar.save('debug/hp_bar.png')
        pivot_part.save('debug/pivot_part.png')
        quantized3.save('debug/quantized3.png')

    return 0
🤓 That’s all for this step. The quantize() function from PIL library will do all the hard works for us. I chose 3 colors here because I want it to include the filling color, background color, and a random color that kind works as a buffer zone for the function. This is based on tests and they show that 2 colors are sometimes not enough. The method we used is a fast octree-based quantization algorithm. There are options but FASTOCTREE is fast and good enough for the job.
Oh, just in case you want to check in with me. ⬇️

🎉 Excellent, next I will be doing step 4 and step 5 together.
Step 4 & 5
To start off, add the this function to Player_HP class.
def _get_hp_percent(self, quantized: Image.Image, bg_threshold: int) -> float:
    """
    Takes in a pivot, quantized, hp bar image and calculate
    the remaining hp percentage. Assuming the background color is
    similar to the actual one and use that to distinguish it from
    the hp color (filling color).

    :param quantized: The pivot, quantized, hp bar image
    :param bg_threshold: The threshold for identifying a column as background
    :return: The remaining hp percentage
    """

    def get_bg_column(col_height, value=38):
        dark_gray = (value, value, value)

        # create a new image with a single column (width=1)
        return Image.new("RGB", (1, col_height), dark_gray)

    def is_column_color_similar(column1, column2, threshold=30):
        return np.linalg.norm(np.array(column1) - np.array(column2)) <= threshold
🤓 We will be getting the final remaining HP in this function. It takes in a quantized image that we got from the last step and a background value threshold. This is a threshold for determining how close a given color is to the background color. The end result should be in range [0.0, 100.0].
We also have two helper functions here. The first one creates a “background_color” column. Its dimension will be 1 x pivot_count. The second one uses linear algebra to calculate the similarity between two columns. With the given threshold, it has some tolerance about identifying two colors as being similar.
You might already see what we are getting to… Now add the rest of the code in _get_hp_percent().
quantized = quantized.convert("RGB")
width, _ = quantized.size
pixels = np.array(quantized)
similar_columns = 0
bg_column = get_bg_column(self._pivot_count, self._bg_value)

for x in range(width - 1, -1, -1):  # iterate column by column from right to left
    # extract the column as an array of colors
    current_column_color = pixels[:, x, :].mean(axis=0)  # average color of the column
    if is_column_color_similar(current_column_color, bg_column, bg_threshold):
        # if the column color is similar to the previous, count it
        similar_columns += 1

# Step 5: calculate HP percentage
hp_percentage = (1 - similar_columns / width) * 100
return hp_percentage
🤓 It looks like we have many things here but actually we already have seen most of them. We save the width of the quantized image from step 3 because we will be iterating through the columns in it. In each step, we compare the current column with a background column. If they are similar, we increment the count by 1. In the end, we should end up with the total number of background columns in quantized image. This is actually equivalent to the area of the background since the height of the columns are the same. We don’t need to consider about the height since we are getting a percentage as final result. The remaining hp can be easily calculated with
\[\text{hp_percentage} = \left( 1 - \frac{\text{similar_columns}}{\text{width}} \right) \times 100\]Go back to get_percentage() and modify the code.
def get_percentage(self):
    # Step 1
    hp_bar = get_chosen_region(self._window, player_hp_bound)
    # Step 2
    pivot_part = self._get_pivot_part(hp_bar)
    # Step 3
    quantized3 = pivot_part.quantize(colors=3, method=Image.Quantize.FASTOCTREE)

    if self.debug:
        hp_bar.save('debug/hp_bar.png')
        pivot_part.save('debug/pivot_part.png')
        quantized3.save('debug/quantized3.png')

    # Step 4 & 5
    return self._get_hp_percent(quantized3, 100)
🤓 bg_threshold = 100. This is a pretty high tolerance but considering that our filling color and background color are quite different. This is an acceptable value.
Now set player_hp.debug to False and run the driver code again (Set to False to avoid overheads). You should get logs like:
40.0
41.05263157894738
43.15789473684211
44.21052631578948
🎉 This is the sign of success. Now we can get the player’s remaining HP ratio. I hope you like this tutorial. Stay tunned for more!
🍯 Happy Coding 🍯
This article, completely original, is copyrighted by its author, me. Please do not reproduce it.
本文为原创作品,作者 Kolyn090 拥有其著作权,受法律保护。严禁复制、转载、仿冒或以任何形式使用。